Limiting dilution analysis attempts to determine the frequency of cells having a particular function that are present in a mixed population of cells. There are many techniques, e.g., staining with monoclonal antibodies, by which one can determine the number of cells bearing a particular "marker" (e.g., CD4) in a cell population, but these techniques may over- or underestimate the number of cells able to perform the function associated with cells bearing that marker.
So limiting dilution analysis is used to measure the abundance of cells able to perform a particular function.
Some examples: determining the frequency ofLet us use B cells as our example in this discussion.
The procedure involves setting up cell cultures with graded dilutions of the cell suspension (e.g. spleen cells) to be tested. If the quantity of active cells in the suspension is so high that each culture receives several B cells of the specificity being tested, then all the cultures will be positive. If the concentration of cells is very low, then only rarely will a positive culture be found. Between these extremes, the response can be quantified as a function of cell dose.
To help us understand the principle of limiting dilution analysis, let us first take, as a hypothetical example, a suspension of cells containing 1000 specific cells in 1000 ml of culture medium. The average number of cells per milliliter, a value we shall designate m, is, of course, one. Let us now dip a pipette into the suspension and withdraw a series of 1-ml samples and place these in individual culture wells. Perhaps you might expect to get exactly one cell at each attempt. But in fact although sometimes you will get one cell, occasionally you will get more than one, and often you will come up empty handed.
The frequency for each of these outcomes follows a Poisson distribution. You can expect to withdraw one cell and to come up empty handed at the same frequency, 0.368 or roughly 37% of the time. The frequencies for the various outcomes are
| 0 | 0.368 |
| 1 | 0.368 |
| 2 | 0.184 |
| 3 | 0.061 |
| 4 | 0.015 |
| 5 | 0.003 |
| >5 | 0.001 |
Although we have no way of distinguishing between culture wells that received one and those that received more of the cells that we are interested in (they will all be positive for the antibodies), we can determine the frequency of cultures receiving none of these cells (no antibodies). We shall call this F0. This value is related to the average number of cells per culture (m) by the expression
F0 = e−m where e = 2.7183, the base of natural logarithms. In our hypothetical example, m = 1 and, as we found, F0 = 0.368.
Having looked at a theoretical example where we "knew" m in advance, let us now turn to a practical example where we are trying to determine m.
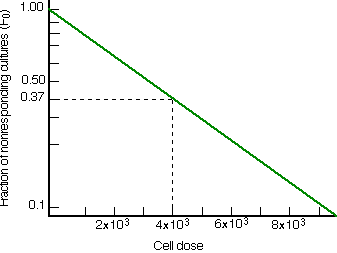
Solving the equation F0 = e−m for m, we get m = −ln F0. Suppose one dilution of a cell suspension gave 10% negative cultures (F0 = 0.1), the average number of cells (m) in each culture would be 2.3. If a greater dilution of the cell suspension gave 20% negative cultures, m becomes 1.6. Whichever dilution of the cell suspension gives 37% negative cultures, m = 1, and we have established the frequency of our cells in the suspension. For example, if 37% of the cultures established with 4000 cells per culture are negative, then the frequency of our cells is 1 in 4000.
Even if none of the dilutions chosen happens to give exactly 37% negative cultures, that value can be determined by interpolation. The log of the fraction of negative cultures is plotted as a function of cell dose.
If one responding cell is all that is needed to produce a positive culture, and if any other cells that participate are present in excess, then the plot should be a straight line extrapolating to 1. The reciprocal of the cell dose that would yield 37% negative cultures gives the cell frequency.
| Limiting dilution analysis. A semilogarithmic plot is made of the fraction of negative cultures as a function of the dose of cells placed in each culture. Assuming that one responding cell is sufficient to produce a positive culture, the cell dose yielding 37% negative cultures gives a frequency of cells in the population capable of responding to the antigen. In this case, a dose of 4 x 10³ cells produced 37% negative cultures; thus the frequency of responding cells in the suspension is 1/4000. |  |
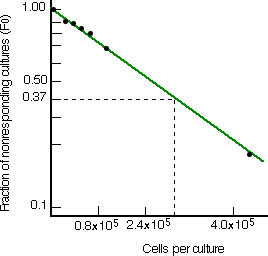
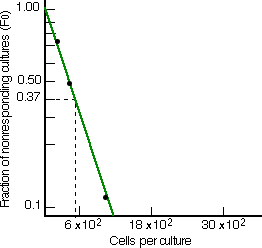
The next graphs show the results of limiting dilution analysis applied to the spleen cells of mice that have never been exposed to the test antigen (left) and mice that have been immunized with the antigen. Immunization raised the frequency of responding cells almost 600-fold. This large increase in the frequency of these cells is characteristic of antigen-primed animals and provides the cellular basis of the secondary response.
 |
Limiting dilution analysis of the frequency of mouse spleen B cells able to develop into clones secreting antibodies of one particular antigenic specificity. Left: The frequency in unprimed mice is approximately 1 in 300,000. Right: After immunization with the antigen, the frequency rises to ~ 1/500. [Data from M. Slaoui et al., J. Exp. Med. 160:1, 1984.] |  |
| Welcome&Next Search |