Enzymes are protein catalysts that, like all catalysts, speed up the rate of a chemical reaction without being used up in the process.
They achieve their effect by temporarily binding to the substrate and, in doing so, lowering the activation energy needed to convert it to a product.
The rate at which an enzyme works is influenced by several factors, e.g.,
- the concentration of substrate molecules (the more of them available, the quicker the enzyme molecules collide and bind with them).
The concentration of substrate is designated [S] and is expressed in units of molarity.
- the temperature. As the temperature rises, molecular motion — and hence collisions between enzyme and substrate — speed up. But as enzymes are proteins, there is an upper limit beyond which the enzyme becomes denatured and ineffective.
- the presence of inhibitors.
- competitive inhibitors are molecules that bind to the same site as the substrate — preventing the substrate from binding as they do so — but are not changed by the enzyme.
- noncompetitive inhibitors are molecules that bind to some other site on the enzyme reducing its catalytic power.
- pH. The conformation of a protein is influenced by pH and as enzyme activity is crucially dependent on its conformation, its activity is likewise affected.
The study of the rate at which an enzyme works is called enzyme kinetics.
Let us examine enzyme kinetics as a function of the concentration of substrate available to the enzyme.
- We set up a series of tubes containing graded concentrations of substrate, [S].
- At time zero, we add a fixed amount of the enzyme preparation.
- Over the next few minutes, we measure the concentration of product formed. If the product absorbs light, we can easily do this in a spectrophotometer.
- Early in the run, when the amount of substrate is in substantial excess to the amount of enzyme, the rate we observe is the initial velocity of Vi.
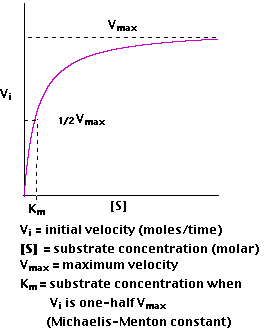
 Plotting Vi as a function of [S], we find that
- At low values of [S], the initial velocity,Vi, rises almost linearly with increasing [S].
- But as [S] increases, the gains in Vi level off (forming a rectangular hyperbola).
- The asymptote represents the maximum velocity of the reaction, designated Vmax
- The substrate concentration that produces a Vi that is one-half of Vmax is designated the Michaelis-Menten constant, Km (named after the scientists who developed the study of enzyme kinetics).
Km is (roughly) an inverse measure of the affinity or strength of binding between the enzyme and its substrate. The lower the Km, the greater the affinity (so the lower the concentration of substrate needed to achieve a given rate).
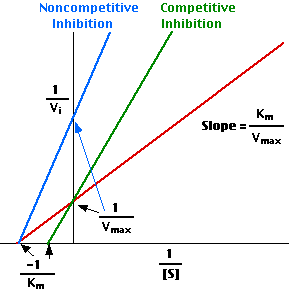
 Plotting the reciprocals of the same data points yields a "double-reciprocal" or Lineweaver-Burk plot. This provides a more precise way to determine Vmax and Km.
- Vmax is determined by the point where the line crosses the 1/Vi = 0 axis (so the [S] is infinite).
- Note that the magnitude represented by the data points in this plot decrease from lower left to upper right.
- Km equals Vmax times the slope of line. This is easily determined from the intercept on the X axis.
 Enzymes can be inhibited
- competitively, when the substrate and inhibitor compete for binding to the same active site or
- noncompetitively, when the inhibitor binds somewhere else on the enzyme molecule reducing its efficiency.
The distinction can be determined by plotting enzyme activity with and without the inhibitor present.
In the presence of a competitive inhibitor, it takes a higher substrate concentration to achieve the same velocities that were reached in its absence. So while Vmax can still be reached if sufficient substrate is available, one-half Vmax requires a higher [S] than before and thus Km is larger.
 With noncompetitive inhibition, enzyme molecules that have been bound by the inhibitor are taken out of the game so
- enzyme rate (velocity) is reduced for all values of [S], including
- Vmax and one-half Vmax but
- Km remains unchanged because the active site of those enzyme molecules that have not been inhibited is unchanged.
This Lineweaver-Burk plot displays these results.
When a slice of apple is exposed to air, it quickly turns brown. This is because the enzyme o-diphenol oxidase catalyzes the oxidation of phenols in the apple to dark-colored products. (A similar enzyme, tyrosinase, converts tyrosine to melanin.)
Let us determine:

- the maximum rate at which the enzyme can perform (Vmax) and
- the Michaelis-Menten constant (Km) for this enzyme
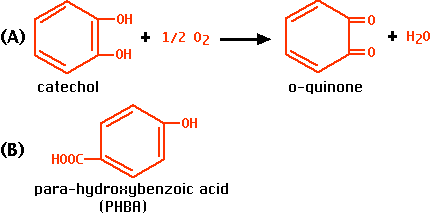
- when it acts alone. We shall use catechol as the substrate. The enzyme converts it into o-quinone (A), which is then further oxidized to dark products.
- when it acts in the presence of a competitive inhibitor. We shall use para-hydroxybenzoic acid (PHBA) (B), which binds the same site as catechol but is not acted upon.
- when it acts in the presence of a noncompetitive inhibitor. We shall use phenylthiourea which binds to a copper atom in the enzyme which is essential for its activity.
Preparing for the Assay:
- Grind up pieces of apple and centrifuge the resulting soup.
- The supernatant is your enzyme preparation.
- Because of the speed with which colored products are formed, we can use the intensity of the color as a measure of product formation.
- We measure this in a spectrophotometer, an instrument that measures the absorbance of monochromatic light passed through the sample. Because the products are yellow-brown, they absorb green light (540 nm) best.
- Set up four tubes with different concentrations of catechol (the substrate). (Catechol is a relative of the active ingredients in the poison ivy plant and, like them, can cause serious contact sensitivity if it gets on one's skin.)
- A = 4.8 mM; B = 1.2 mM; C = 0.6 mM; D = 0.3 mM
- Add a fixed amount of enzyme preparation to Tube A and measure the change in absorbance (Optical Density) at 540 nm) at 1 minute intervals for several minutes.
- Record the average change in OD540 per minute (Δ
OD540).
- Because the OD is directly proportional to the concentration of the products, we can use it as a measure of the rate or velocity of the reaction (Vi).
- Repeat with the other three tubes.
| |
Tube A |
Tube B |
Tube C |
Tube D |
| [S] |
4.8 mM |
1.2 mM |
0.6 mM |
0.3 mM |
| 1/[S] |
0.21 |
0.83 |
1.67 |
3.33 |
Δ OD540
(Vi) |
0.081 |
0.048 |
0.035 |
0.020 |
| 1/Vi |
12 |
21 |
29 |
50 |
The table above summarizes the results.

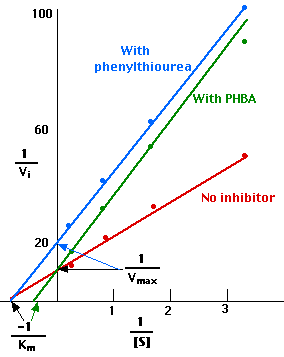
Making a Lineweaver-Burk plot of these results shows (red) that
- 1/Vmax = 10, so Vmax = 0.10
- −1/Km = − 0.8, so Km = 1.25 mM
- (In other words, when [S] is 1.25 mM, 1/Vi = 20, and Vi = 0.05 or one-half of Vmax.)
As before, but this time add a fixed amount of a solution of PHBA to each of the four tubes.
The table below summarizes the results.
| |
Tube A |
Tube B |
Tube C |
Tube D |
| [S] |
4.8 mM |
1.2 mM |
0.6 mM |
0.3 mM |
| 1/[S] |
0.21 |
0.83 |
1.67 |
3.33 |
ΔOD540
(Vi) |
0.060 |
0.032 |
0.019 |
0.011 |
| 1/Vi |
17 |
31 |
53 |
91 |
The Lineweaver-Burk plot of these results is shown above in green.
- 1/Vmax = 10, so Vmax remains 0.10.
- Now, however, −1/Km = − 0.4, so Km = 2.50 mM
- (In other words, it now takes a substrate concentration [S] of 2.50 mM, to achieve one-half of Vmax.)
As before, but this time add a fixed amount of a solution of phenylthiourea in each of the four tubes.
The table below summarizes the results.
| |
Tube A |
Tube B |
Tube C |
Tube D |
| [S] |
4.8 mM |
1.2 mM |
0.6 mM |
0.3 mM |
| 1/[S] |
0.21 |
0.83 |
1.67 |
3.33 |
ΔOD540
(Vi) |
0.040 |
0.024 |
0.016 |
0.010 |
| 1/Vi |
25 |
42 |
63 |
100 |
The Lineweaver-Burk plot of these results is shown above in blue.
- Now 1/Vmax = 20, so Vmax = 0.05.
- But −1/Km = − 0.8, so Km = 1.25 mM as it was in the first experiment.
- So once again it only takes a substrate concentration, [S], of 1.25 mM to achieve one-half of Vmax.
Here, then, is a method by which catalytic power of different enzymes can be compared.
The table gives Km values (mM) for several enzymes - some of which you can encounter with links to other pages on this site.
31 January 2011
 Plotting Vi as a function of [S], we find that
 Plotting the reciprocals of the same data points yields a "double-reciprocal" or Lineweaver-Burk plot. This provides a more precise way to determine Vmax and Km.
 Enzymes can be inhibited
 With noncompetitive inhibition, enzyme molecules that have been bound by the inhibitor are taken out of the game so

